
Stratification at Station Papa
The following plot is derived as follows:
- Select Argo profiles within a calendar month in a large area surrounding Ocean Station Papa.
- Interpolate using objective analysis to create profiles at Papa at monthly intervals.
- Plot the density anomaly (sigma-t [kg/m3]) versus pressure and time.
![density anomaly (sigma-t [kg/m<sup>3</sup>]) versus pressure and time](/isdm-gdsi/argo/canadian-products/LineP/StationP26_density_20240513.png)
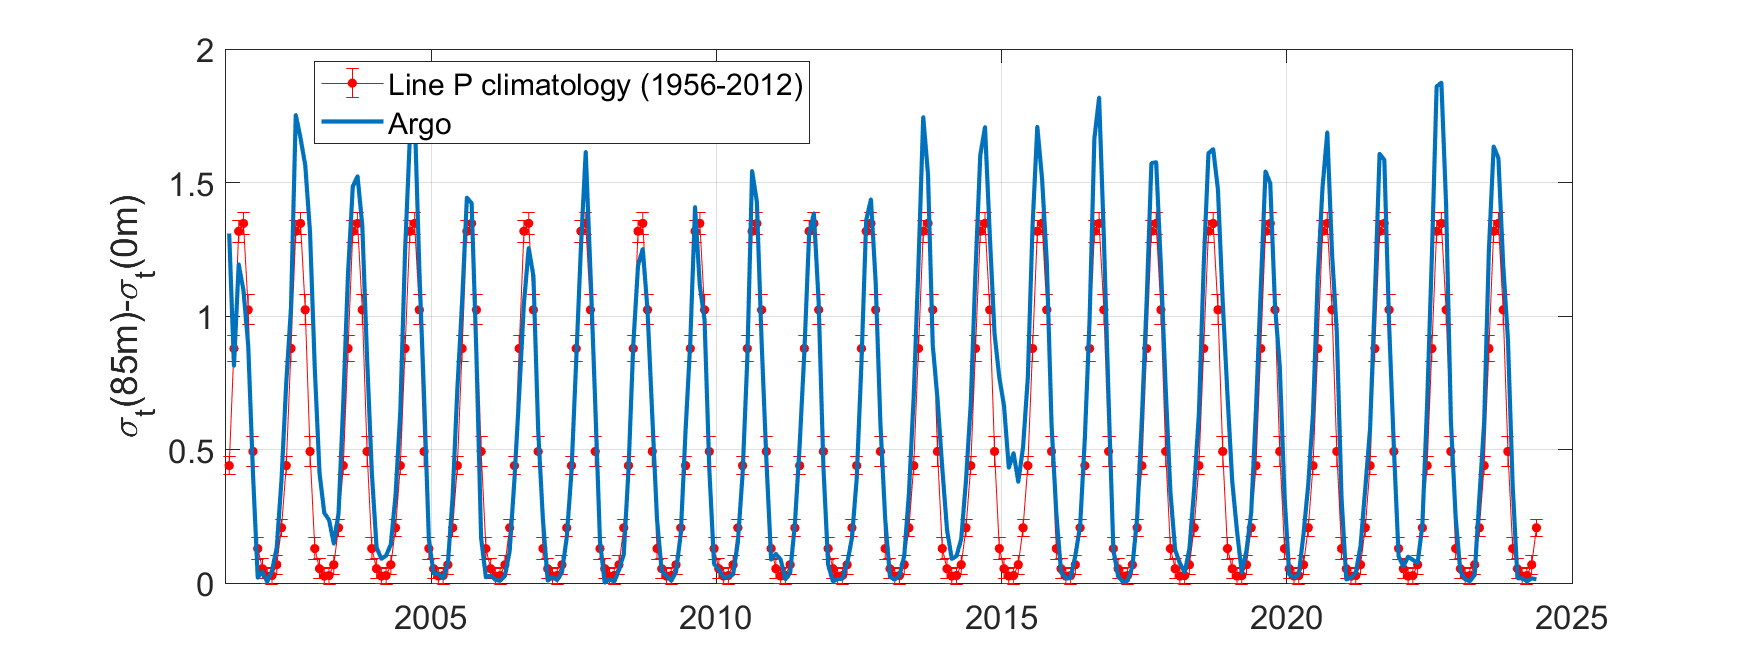
The following plot is derived as follows:
- Select Argo profiles within a calendar month in a large area surrounding Ocean Station Papa.
- Interpolate using objective analysis to create profiles at Papa at monthly intervals.
- Plot the density anomaly (sigma-t) differences between 75m depth and the surface.
- Date modified: